Kilojoules and fast food – the “in-your-face” facts
Written by Catherine Saxelby
on Thursday, 27 January 2011.
Tagged: eating out, fast food, healthy snacks, junk food, snacks, take-away

From 2011, all major NSW fast food chains were required to display the kilojoule (Calorie) counts of their food with the same prominence as the price. For instance, the Grand Angus has 2,780 kilojoules (662 Calories). This “in-your-face” information is designed to make consumers take stock of what they, and their children, are eating.
US studies have shown that parents order healthier meals for their children when the kilojoule count of a food is displayed – although their own eating habits remain unchanged. A case of ‘Do as I say’, not ‘Do as I do’?
It’s not only the Macca’s, Pizza Huts, Pizza Havens, Eagle Boys and KFCs that have to comply. Any food outlet that has 20 or more outlets in NSW, or 50 or more nationwide, have to display the average adult daily energy intake of 8700 kJ plus the kilojoule content of their foods.
Kilojoule counts are also coming to Victoria by 2012. The NSW Heart Foundation supports the initiative but will lobby for the outlets to display the quantities of saturated fats and salt too.
It’s so easy to overdo it
Many people don't realise that they can easily consume almost 50 per cent of their daily kilojoule allowance just by eating “a big hamburger” plus “big fries" eg:
Big Mac 2060 kJ 24%
Large fries 1900 kJ 22%
TOTAL 3960 kJ 46%
Similarly, not many realise that a couple of doughnuts is not a mere snack but anywhere from 20 to 36 per cent of your day’s total depending on what sort you choose (cinnamon, cream-filled, iced, etc). And that’s before we tote up the thickshake or milky flat white you wash them down with.
Two doughnuts, cinnamon 1726 kJ 20%
Two doughnuts, choc iced, cream-filled 3150 kJ 36%
Two reasons why I’m in favour of kilojoule counts
Highly visible kilojoule counts:
1. get you thinking and talking about how fattening most fast food is. It’s loaded with too many kilojoules, as well as too much saturated fats, trans fats and salt, and it’s served in super-sized portions. It’s easy to keep eating it once you start (“passive over-consumption”). There’s little in the way of fibre, vegetables or whole grains to apply the brakes!
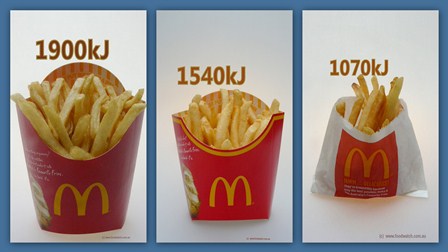
2. allow you to compare and contrast the menu offerings easily. You can quickly run your eye over the kilojoules on a menu board and note what’s high and what’s low. For example, if you can see that large fries have almost double the kilojoules of small fries, you can choose to opt for the small bag. Or seeing the kilojoules may help you down scale to a single burger instead of a double burger with extra cheese and a hash brown. Or – God forbid- a Tower Burger or Quad Stack.
|
Food |
kJ |
Cals |
%DI |
|
Fries, large |
1900 |
452 |
22% |
|
Fries, medium |
1540 |
368 |
18% |
|
Fries, small |
1070 |
255 |
12% |
Will it deter people from buying fast food?
I think not. If you are in a hurry and want to grab a quick meal on the road, you’re still going to pull over into the drive-through at a burger, pizza or chicken place. Only now the kilojoule counts may impose a little reflection before you purchase. How helpful this nanny-state government move will be in stemming the obesity problem remains to be seen.
While some early studies were favourable, other studies have reported that menu labelling has made no difference at all - which is a pity. For instance, experience in the US shows that forcing fast food chains to display nutrition labelling has done little to change people’s eating habits. Maybe that’s just the US. A simple logo identifying which foods are healthiest may be simpler and more effective.
Still got some questions?
This initiative, which I applaud, needs some explanations. Without an education program behind it, most people will have trouble understanding how the kilojoules apply to themselves. For example:
 Who is an “average” adult? Is it an average male or an average female? How close are you to the “average”?
 - How do you decide how many kilojoules your 5 year old daughter and 12 year son should have?
- What’s a kilojoule anyway and how does it relate to calories? Many people still don’t understand kilojoules and think only in terms of calories.
The answers
I’ve put together a downloadable pdf that you can print out that provides you with the following:
- A list of the kilojoules, calories and their % of Daily Intake for 85 of the most popular fast food and take aways foods. It’s a handy pocket version of the list below.
- The 8700 kJ daily intake refers to an “average” adult. This figure is used by food companies to calculate their % Dietary Intake figure on the thumbnails on food labels. Tables 2 and 3 in the pdf shows the intake for men and women of all ages for light physical activity.
- Kids’ levels are harder to define. We’ve all seen two seven year olds – one who’s tiny and the other who’s really tall. Should they both have the same intake? Table 4 in the pdf is an attempt to give you the broad averages from sedentary to sporty types.
- A calorie = 4.186 kilojoules. A bit hard to remember! That’s why in the main Table 1 you’ll find figures for 85 fast food items in both kilojoules with their calorie equivalent. If you ever find yourself without it and having to work it out for yourself just err on the side of caution and divide the kilojoules by 4 to get a rough estimate of the calories. For more on calories and kilojoules, read my handy article How to convert kilojoules to calories.
Kilojoules, calories and % daily intake in your favourite fast food
|
Food |
Kilojoules (kJ) |
Calories (Cals) |
% of your day’s recomm intake |
|
McDonald's Big Mac |
2060 |
490 |
24% |
|
Quarter Pounder |
2300 |
548 |
26% |
|
Double Quarter Pounder |
3570 |
850 |
41% |
|
Grand Angus |
2780 |
664 |
32% |
|
Cheese Burger |
1180 |
282 |
14% |
|
McChicken |
1710 |
407 |
20% |
|
Filet-o-Fish |
1270 |
303 |
15% |
|
Nuggets, 6 |
1160 |
276 |
13% |
|
Nuggets, 3 |
582 |
139 |
7% |
|
Fries, large |
1900 |
452 |
22% |
|
Fries, medium |
1540 |
368 |
18% |
|
Fries, small |
1070 |
255 |
12% |
|
|
|
|
|
|
Salads Seared Chicken Salad |
714 |
170 |
8% |
|
Crispy Chicken Salad |
1200 |
287 |
14% |
|
Garden Salad w Italian dressing |
121 |
29 |
1% |
|
|
|
|
|
|
Wraps Mini Chicken Seared Snack Wrap |
868 |
207 |
10% |
|
Seared Chicken Sweet Chilli Wrap |
1520 |
363 |
17% |
|
Seared Chicken Ceasar Wrap |
1660 |
396 |
19% |
|
Crispy Chicken Sweet Chilli Wrap |
1940 |
412 |
20% |
|
Crispy Chicken Caesar wrap |
2060 |
562 |
27% |
|
|
|||
|
Breakfast Bacon & Egg McMuffin |
1240 |
296 |
14% |
| Hashbrown | 638 | 152 |
7% |
| Hotcakes - Syrup & Butter | 2760 | 659 |
32% |
|
|
|
|
|
|
Burger King Whopper |
2889 |
690 |
33% |
|
Whopper with cheese |
3256 |
778 |
37% |
|
Ultimate Double Whopper |
4884 |
1167 |
56% |
|
Whopper junior with cheese |
1683 |
402 |
19% |
|
The Aussie burger |
3618 |
864 |
42% |
|
Grilled chicken classic |
1562 |
373 |
18% |
|
Vegie Whopper |
3037 |
725 |
35% |
|
Onion rings, regular |
1259 |
301 |
14% |
|
French fries, small |
999 |
239 |
11% |
|
French fries, regular |
1566 |
374 |
18% |
|
French fries, large |
2147 |
513 |
25% |
|
|
|
|
|
|
Pizza, average * Deep pan (3 medium slices) |
|
|
|
|
BBQ Meat Lovers, Pizza Hut, 291 g |
3558 |
847 |
41% |
|
Super Supreme Dominos, 229g |
2292 |
546 |
26% |
|
Hawaiian |
2921 |
695 |
34% |
|
Cheese lovers |
3219 |
766 |
37% |
|
Vegetarian |
2836 |
675 |
33% |
|
|
|
|
|
|
Thin crust (3 medium slices) BBQ Meat Lovers |
2524 |
601 |
29% |
|
Super Supreme |
2349 |
559 |
27% |
|
Cheese lovers |
2346 |
559 |
27% |
|
Hawaiian |
2579 |
614 |
30% |
|
Vegetarian |
2007 |
478 |
23% |
|
|
|
|
|
|
Fried chicken 2 pieces of fried chicken |
2163 |
515 |
25% |
|
Quarter chicken (leg) |
1422 |
339 |
16% |
|
Quarter chicken (leg) and chips |
3248 |
773 |
37% |
|
Chicken fillet burger |
2277 |
542 |
26% |
|
Bacon and cheese fillet burger |
2479 |
590 |
28% |
|
Bondi Burger (Oporto) |
2257 |
537 |
26% |
|
Rooster Roll (Red Rooster) |
2735 |
651 |
31% |
|
Nuggets, 6 |
1270 |
303 |
15% |
|
Chips, regular |
955 |
228 |
11% |
|
Mashed potato and gravy (KFC) |
329 |
79 |
4% |
|
Twister wrap (KFC) |
2167 |
518 |
25% |
|
Popcorn chicken (large, KFC) |
3087 |
737 |
35% |
|
|
|
|
|
|
Subway Cold subs 6” Turkey |
1160 |
276 |
13% |
|
6” Turkey Breast & Ham |
1100 |
263 |
13% |
|
6” Roast Beef |
1090 |
260 |
12% |
|
6” Subway Club |
1130 |
270 |
13% |
|
6” Tuna |
1380 |
330 |
16% |
|
|
|
|
|
|
Hot Subs 6” Roasted Chicken |
1180 |
282 |
14% |
|
6” Meatball |
1710 |
408 |
20% |
|
6” Cheese Steak |
1440 |
344 |
17% |
|
6” Italian BMT |
1560 |
373 |
18% |
|
|
|
|
|
|
Subway Salads with Ranch dressing Roasted chicken |
813 |
194 |
9% |
|
Club |
783 |
186 |
9% |
|
Tuna |
1206 |
287 |
14% |
|
Veggie Delite |
500 |
119 |
6% |
|
|
|
|
|
|
Take-aways |
|
|
|
|
Sushi, Average all types, per 6 pieces |
1170 |
280 |
13% |
|
Sausage roll with sauce |
2010 |
479 |
23% |
|
Meat pie with sauce |
1655 |
394 |
19% |
|
Steak sandwich |
1498 |
357 |
17% |
|
Fish 'n' chips |
3760 |
895 |
43% |
|
Grilled fish with chips |
2580 |
614 |
30% |
|
Doughnuts, Krispy Kreme, 2 original glazed |
1908 |
454 |
22% |
|
Doughnuts, Krispy Kreme, 2 cinnamon |
1726 |
411 |
20% |
|
Doughnuts, Krispy Kreme, 2, Choc iced |
2370 |
564 |
27% |
|
Doughnuts, Krispy Kreme, 2 Choc iced cream-filled |
3150 |
750 |
36% |
|
Doughnuts, Donut King, cinnamon, 2 |
1250 |
299 |
14% |
|
Muffin, Muffin Break, Berry Crunch Hi-Fibre |
2540 |
606 |
29% |
|
Muffin, Muffin Break, Apple Berry Bran, 167g |
2060 |
492 |
24% |
|
Cookie, Muffin Break, Chocolate Chip Regular, 90g |
1560 |
373 |
18% |
|
Cookie, Muffin Break, Chocolate Chip Jumbo, 200g |
3520 |
841 |
40% |
|
Recommended day’s intake* |
8700 |
2000 |
|
Source: Analyses from fast food chains and take-away shops as at 14 Jan 2013. Pizza figures average of national chains including Pizza Hut, Pizza Haven, Dominos and Eagle Boys
*Based on the recommended day’s intake for an average adult.
To work out calories, divide kilojoules by 4.186 or simply 4.
Calorie/kilojoules counts on fast food menus in the news
Calorie counts no effect on what kids order
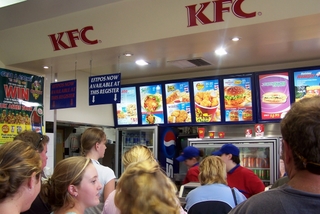 Listing calories on fast food menus does not seem to affect the choices of children and adolescents in low income communities, or choices that their parents make for them, says a 2010 study. This research was conducted in 2008 before and after implementation of the calorie labelling law in New York. The scientists collected receipts and conducted short interviews with consumers from four fast food chains, McDonald's, Burger King, Wendy's and Kentucky Fried Chicken, based in New York (where calorie labelling had just become mandatory) and Newark, New Jersey (which they used as control).
Choice surveys the worst of fast food (and gives you healthier options)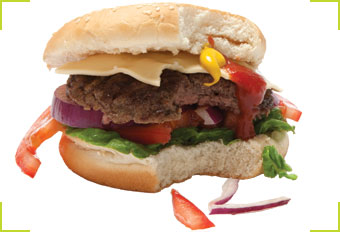 Oporto, Red Rooster, Subway, Domino's, Pizza Hut, KFC, Hungry Jack's, McDonald's. Burgers and chips, sushi, noodles, pizza, wraps – we're spoilt for choice when it comes to convenient fast food. Choice looks at the worst and best choices including things from healthier menus as well as those whoppers and quad stacks that young males love to wolf down. Read more.
Only one in 6 fast-food customers cut calories after US food labelling system introduction
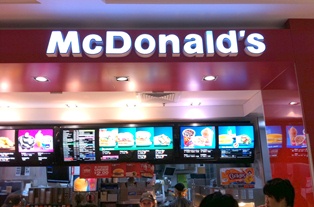 Around a sixth of fast food customers used calorie information and, on average, bought food with106 fewer lower calories than customers who did not see or use the calorie information. The study tracked the introduction of a menu labelling system in the US, with results published in the British Medical Journal. US researchers found there has been a small but positive impact from a law introduced in 2008 in New York requiring chain restaurants with 15 or more branches nationally to provide calorie information on menus and menu boards in the city.
For example, at McDonalds, average energy per purchase fell by 5.3%, at Au Bon Pain, it fell by 14.4% and at KFC, it dropped by 6.4%. Together, these three chains represented 42% of all customers in the study. However, average energy content increased at one chain – Subway – by 17.8% where large portions were heavily promoted.
You may also be interested in...
Foodwatch
The Good Stuff
The Boring Stuff
© 2025 Foodwatch Australia. All rights reserved
Website by Joomstore eCommerce


