5 years of Health Star Ratings – are they working?

Five years after its implementation in June 2014, a review of the Health Star Rating (HSR) has found it performs well. Studies have shown that seeing the logo on the front of a pack effectively directs shoppers towards buying foods lower in kilojoules (Calories), saturated fats, sugars and sodium.
Is it all positive? Or are there a few problems that still need to be ironed out? Take a look at my thoughts…
What you’d expect
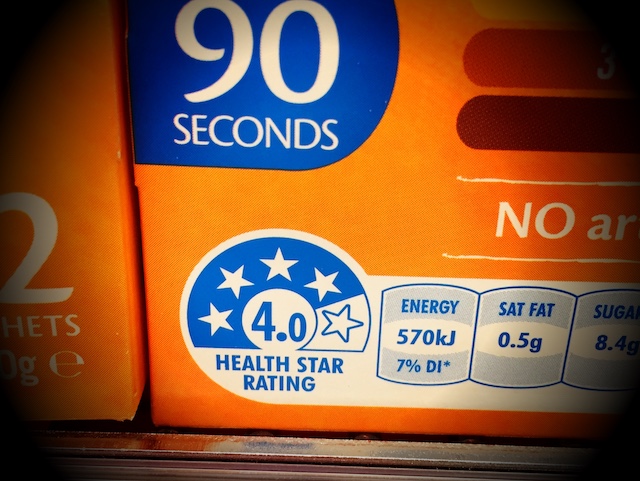
I think that you’d expect that basic foods like vegetables, fruits, meat and fish would score an average HSR of 4 while discretionary foods like confectionery and snacks would score lower, with an average of 2.
To me, this indicates a good alignment with the Dietary Guidelines which encourage us to eat more basic staples and to cut back on ‘processed junk’.
In Australia, I found it interesting that the products with the highest uptake of the voluntary rating are:
- non-dairy beverages: 608 products (11% of products displaying the HSR)
- processed meat and seafood: 459 products (8%)
- processed fruits and vegetables including legumes: 386 products (7%)
- savoury snacks: 381 products (7%)
- dairy products including dairy alternatives: 367 products (7%)
Interestingly, only a small number of retailers and manufacturers are responsible for a large proportion of the uptake. Coles, Woolworths and Aldi Private Labels collectively accounted for 56 per cent of the total. Five manufacturers (Simplot, Nestlé, Lion, Coca-Cola Amatil and Unilever) collectively accounted for 16 per cent of total uptake. So it would appear that only the big companies have the resources needed to introduce it.
In summary, the Review says these four positive things about the Stars:
- The HSR is being displayed on approximately one-third of packaged foods in Australian and New Zealand supermarkets, with uptake steadily increasing since its introduction.
- Most Australian and New Zealand consumers view the HSR as easy to understand and use and feel that it makes it easier for them to decide which packaged foods are healthier.
- In Australia, 23 per cent of surveyed consumers were influenced by the HSR to change their purchasing behaviour and purchase a product with more Stars. In New Zealand, 28 per cent of surveyed consumers used the HSR to help choose a product, with the vast majority choosing the product with more Stars.
- The HSR System is also encouraging positive reformulation of foods, with New Zealand research showing that 79 per cent of products displaying the HSR had been reformulated since 2014.
Many products have been reformulated to reduce sodium, sugars and/or saturated fat and increase wholegrains and fibre to boost the nutritional profile as a direct result of the HSR System. For example, I have documented how one manufacturer reformulated a breakfast cereal to reduce salt content by 25 per cent, dropped the sugar by 17 per cent and boosted the fibre by a huge 66 per cent. Read more here.
There are 10 recommendations:
- The HSR System should be continued.
- The icon for energy only, which is approved as a graphic Option 5, should be removed. It is not well understood and is currently being over-used by confectionery and sweetened soft drink makers.
- Governments, industry, public health and consumer bodies should continue to promote the HSR System.
- Changes should be made to the way the HSR is calculated to better align with Dietary Guidelines, reflect emerging evidence and address consumer concerns. The Review suggests the following:
- fruits and vegetables that are fresh, frozen or canned (with no additions of sugar, salt or fat) should automatically receive an HSR of 5.
- total sugars should be more strongly penalised, lowering the HSRs of 5% of products (including breakfast cereals, snack bars, sweetened milks, ice creams and sugar-based confectionery)
- sodium sensitivity should be improved for products high in sodium, reducing the HSR of 1% of products (all with sodium in excess of 900mg/100g such as soy sauce)
- dairy categories should be redefined to increase the HSRs of dairy foods such as cheese and yoghurt and decrease the HSRs of some dairy desserts, improving comparability between dairy products.
- jellies and water-based ice confections should be re-categorised to decrease their HSRs.
Based on modelling, these changes are expected to decrease the HSRs of approximately 10% of products (mostly discretionary foods) and increase the HSRs of approximately 6% of products (mostly basic foods such as fruits, vegetables, yoghurts and cheeses).
The HSR System fails to adequately distinguish between added sugars and intrinsic or naturally-occurring sugars. Having said that, there is currently no agreed definition of added sugars, nor is there an analytical method for measuring only added sugars, as these are chemically identical to intrinsic sugars and are processed by the body in the same way.
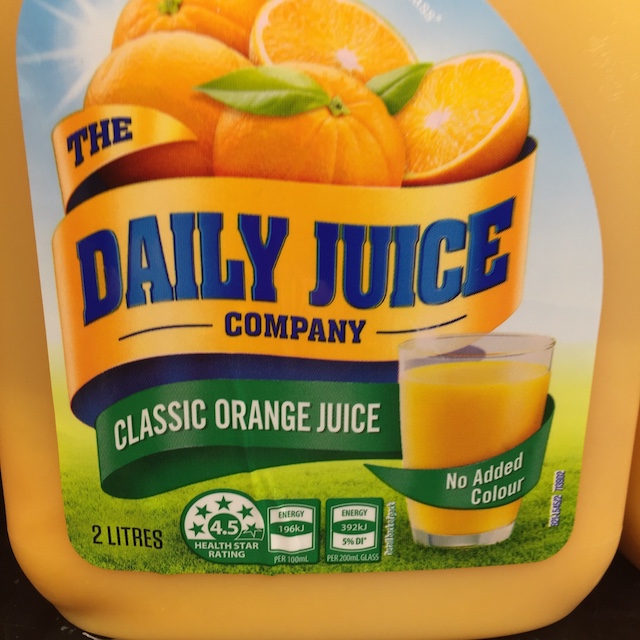
- The way the HSR is calculated for non-dairy beverages like sports drinks or fruit juice should be changed. It should be based on the points from sugars, energy and fruit/vegetables/nuts/legumes, to better differentiate water (and drinks similar to water) from high-sugared drinks.
Currently, fruit juices with relatively high total sugars receive HSRs of 4 to 5, while unsweetened flavoured waters generally receive HSRs of around 2 (despite having no sugars and being closer in nutritional profile to plain water).
The proposed changes mean that:
- plain waters will have an HSR of 5
- unsweetened flavoured waters 4.5
- 100% fruit and vegetable juices between 2.5 and 4 (based on their sugars and energy content)
- diet drinks no more than 3.5
- sugary soft drinks between 0.5 and 2 (based on their sugars and energy content).
This seems much fairer to me.
- The Stars should continue to be jointly funded by Australian and New Zealand governments for a further four years.
- A few minor changes should be made to the governance of the system.
- Public health initiatives should be enhanced by
- regular updates to the Dietary Guidelines
- regular national nutrition surveys
- establishment of a comprehensive, dataset of branded food products
- improved monitoring of the System.
- The system should remain voluntary, but with clear targets. If the HSR is not displayed on 70 per cent of products within five years, the HSR System should be made compulsory.
- The existing Guide for Industry and the Style Guide should be revised and strengthened, providing greater certainty for stakeholders.
Anomalies are recognised
The Review lists several anomalies that are obvious now:
- Canola oil is rated with 5 Stars as it has a lower saturated fat whilst olive oil only gets 4 Stars, even though it is cold-pressed and grown in Australia (less processing than canola).
- Milo drink gets 4 Stars when mixed with milk but only 1.5 without milk (dry powder),
- The HSR give no advantage to buying wholegrain varieties over refined products (for example, choosing between white and wholegrain bread, or white and brown rice). This is a serious omission as there’s lots of research into the benefits of whole grains.
The Health Stars on the Foodwatch website
Over the years I’ve written about both the Health Star Ratings themselves and some surprising products that have managed to score 4 and 5 stars. I’ve listed them below so you can check them out.
The Health Star Rating – what is it and what does it mean for you
5 steps to calculate the Health Star Rating
The Worst 30 Foods for you to eat (beware)
Product snapshot: FroPro – 5 Star ice cream
How does Nutri-grain breakfast cereal score 4 Stars?
Product Snapshot - Noshu 99% Sugar Free Fudgy Brownies
The bottom line
The Stars are currently voluntary and only appear on packets at the discretion of manufacturers. This is a major shortcoming – it needs to be on virtually every food at a supermarket for it to work.
This Review, whilst based on the best available evidence, aims to keep the HSR System as simple as possible and is intended to support consumers to choose between like products. For instance, it helps when trying to choose between two muesli bars or two breakfast cereals. Don’t use it to compare wildly-differing foods such as an apple compared to smoked salmon. It won’t help you.
You can’t use it to find out where your food has been grown, if it’s organic or nut-free, if it’s grass-fed or wild-caught or its degree of processing. It was never intended as a complete source of dietary advice - you’d have to see a dietitian for that. You can read the full review yourself here.


